RE/MAX NATIONAL HOUSING REPORT Q3 2022
Property Market Activity Levels Off
For almost every month this year, the RE/MAX of Southern Africa network has beaten its own recording-breaking sales results for 2021. While the brand continues to excel, there are signs that the market is finally starting to cool off following the post-pandemic boom of activity within the local housing market.
“For eight of the nine months recorded for this year thus far, our total reported sales values outperformed last year’s record-breaking figures. Our total reported sales values YTD are up about 6% on last year and registration values about 4% for the same period, while number of properties sold (units) is down around 4% YTD on last year,” says Regional Director and CEO of RE/MAX of Southern Africa, Adrian Goslett.
Goslett adds that the RE/MAX SA network’s total units sold increased YoY in June, July, and August; but, dropped slightly in September. This seems to align with greater market trends following the two steep 75 basis point interest rate hikes in both July and September.
According to Lightstone Property data, as at 04 October, the number of transfers (both bonded and unbonded) recorded at the Deeds Office for the period July to September 2022 amounted to 60,700*. When reviewed against the figures from previous RE/MAX National Housing Reports, this amount is down by 22% on last quarter and up by 1% YoY. The same data also reflects that a total of 42,784 bond registrations were recorded at the Deeds Office over the period July to September 2022. The RE/MAX National Housing Reports reveal that this figure is down by 3% on Q3 2021’s figures.
Of the 60,700 transfers, a total of 29,503* freehold properties and 16,536* sectional title units were sold countrywide (these figures exclude estates, farms, and land only transfers). Reviewed against previous RE/MAX National Housing Reports, the number of freehold properties registered dropped by 21% compared to the results of last quarter and stagnated at 0% YoY. Sectional titles, however, increased by 10% YoY and dropped by 20% QoQ.
Activity increases in higher price brackets
Sales volumes between the various price segments shifted during the third quarter of 2022. The number of transfers above R800,000 grew proportionally more than transfers priced below R800,000. Transfers over R3 million grew from 7,2% of all transfers in Q2 to 8,1% of all transfers in Q3 2022. Similarly, transactions between R1,5 million to R3 million grew from 19,5% of all transfers in Q2 to 20,5% of all transfers in Q3. Transactions between R800,000 and R1,5 million grew from 26,2% in Q2 to 27,5% in Q3.
However, transactions between R400,000-R800,000 dropped from 23% of all transfers in Q2 to 21,8% of all transfers in Q3. Transaction below R400,000 also dropped from 24,2% in Q2 to 22,2% in Q3 2022.

Average house prices stagnate
Lightstone Property reported in September 2022 that national year-on-year house price inflation is at 3.23%, having decreased consistently since early 2021.
According to Lightstone Property data as at 04 October 2022, the nationwide average price of sectional titles is R1,054,357*. When reviewed against the figures from previous RE/MAX National Housing Reports, this amount reflects 0% growth for the same period last year and last quarter.
Based on the same data, the nationwide average price of freehold homes is R1,436,555*. When reviewed against the figures from previous RE/MAX National Housing Reports, this amount increased by 6% YoY and by just 1% compared to last quarter. The Average Active RE/MAX Listing Price for the third quarter dipped by 25% YoY and 3% QoQ and amounted to R3,086,945.65.
Home loan values decrease QoQ
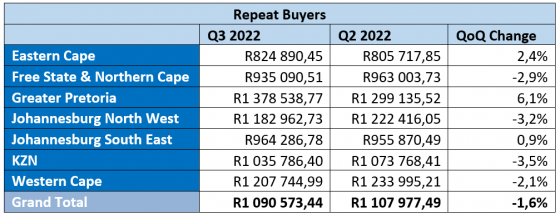
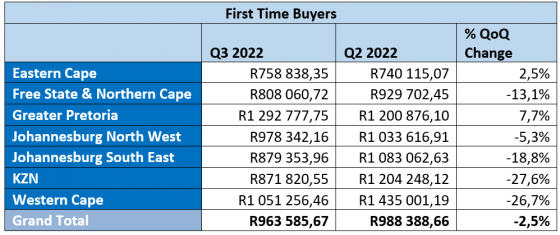
BetterBond reports that on average, the loan amount granted to repeat buyers dropped by 1,6% compared to last quarter. For first-time buyers, the average bond amount dropped by 2,5% when compared to the previous quarter.


Western Cape outperforms all provinces
With ongoing load shedding, the Western Cape continues to be a popular destination for semigration, so much so that all the top five searched suburbs on remax.co.za are once again found in this region:
- Parklands, Western Cape – 2674 searches
- Bloubergstrand, Western Cape – 2638 searches
- Sunningdale, Western Cape – 2479 searches
- Claremont, Western Cape – 2414 searches
- Sea Point, Western Cape – 2197 searches
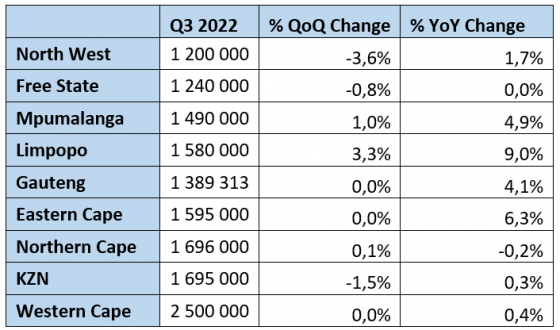
The Western Cape also continues to be the most expensive province. According to Private Property, the median asking price per province of active listed stock on Private Property for Q3 2022 were as follows:

** Disclaimer: The data reflected herein represents data that is voluntarily obtained from subscribers from the Private Property South Africa’s website and is based solely on data collected by Private Property South Africa (Pty) Ltd. Further, the data reflected herein is accurate as per the Private Property South Africa database dated 12 October 2022. Reliance on such data is at the sole discretion of subscribers and Private Property South Africa hereby indemnifies itself of any consequence of such reliance.
Final thoughts
“Things will get a little tighter still as we move into next year. If SA’s GDP is predicted to be at 1.4% levels next year (down from around 2%) it will put further pressure on the unemployment rate, creating a predicament for government to support its people with money it doesn’t have. This could lead to it ‘knocking on the door’ of its people that do have. Should taxes increase to make up for revenue deficiencies there will be less disposable income for families to spend on other goods and services, including home loans and rental fees. We’ve been saying for months now that we recommend consumers find ways to cut any excess and get as financially fit as possible. All that said, people still need to live somewhere. Over the years, in good markets and in bad, there has been movement in the property industry because people are always buying and people are always selling. The savvy buy during the lows and sell during the highs. Easier said than done, for sure, but the sooner you get into the property market at what is still considered very competitive lending rates, the better,” Goslett concludes.
*Figures according to Lightstone Property. Data captured on 04 October 2022
Send to a Friend